Continuous assurance
The safety case stops being a document assembled before a milestone and becomes a live view of what is still supported by evidence.
The problem
Assurance is assembled, not lived. Hazards, claims, arguments and evidence sit in separate documents owned by separate teams, and someone reconciles them by hand in the weeks before each milestone.
The consequence is that the safety case is only true on the day it was compiled. An assumption that changed two months ago is still quietly holding up an argument nobody has revisited, and the first time anyone notices is during review.
- Hazard analysis in one spreadsheet, claims in a document, evidence in a test system
- Reconciliation is manual and repeats before every milestone
- A changed assumption leaves no trace on the claims that depended on it
- “Is this still true?” can only be answered by re-reading everything
How it works here
The hazard analysis stays a sheet and the safety case stays a document. Nobody is asked to learn an assurance tool.
Each hazardous event, claim, argument and piece of evidence is an object with identity. A claim holds the evidence that supports it rather than citing it in prose.
The ISO 26262 pack supplies the classification lattice, the derivation rules and what a complete argument looks like, so the checks come with the domain.
Walkthrough
Every capture below is the running product, in the order the work happens.
- Step 1
The hazard analysis is a sheet, and every row is an object
Hazardous events are classified with severity, exposure and controllability, and the resulting ASIL is derived rather than typed. Each row carries an identity that the rest of the programme can point at.
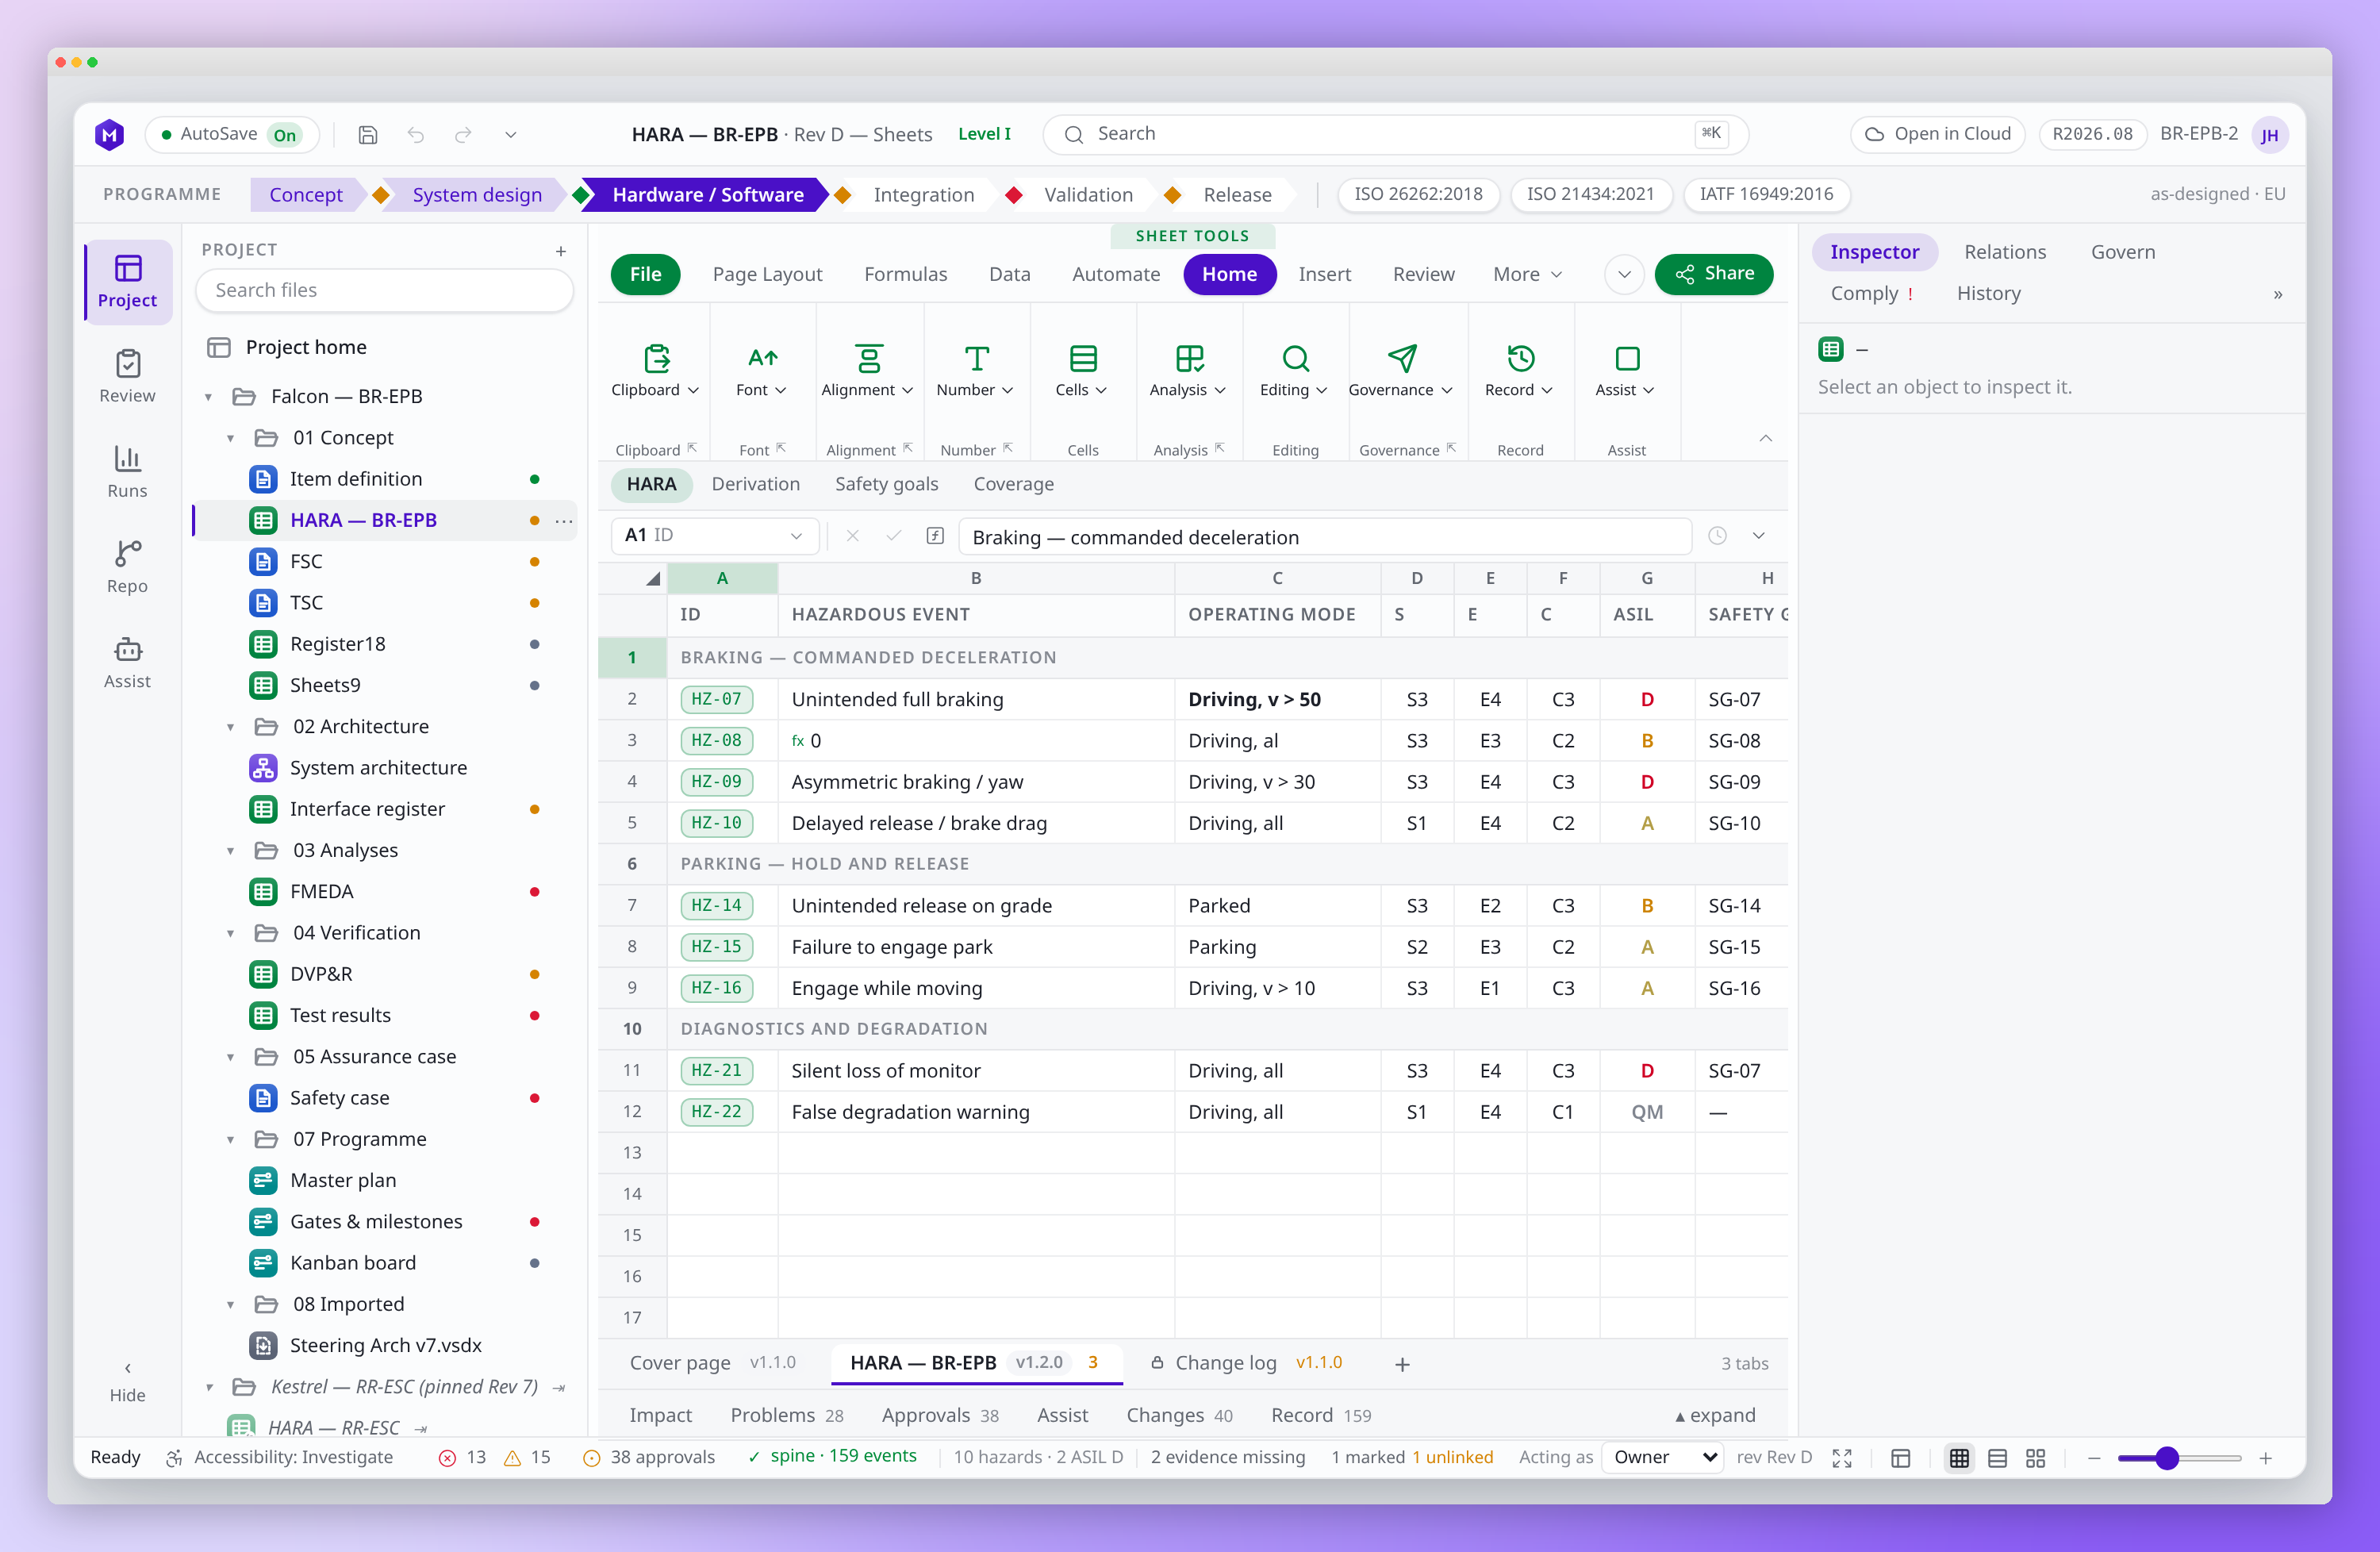
1The status bar tracks the whole file: 10 hazards, 2 at ASIL D, 2 with evidence missing. - Step 2
The safety case reads from the same objects
Claims and arguments are written in a normal document, but the evidence references are live links to the hazard rows, the analyses and the verification records they name.
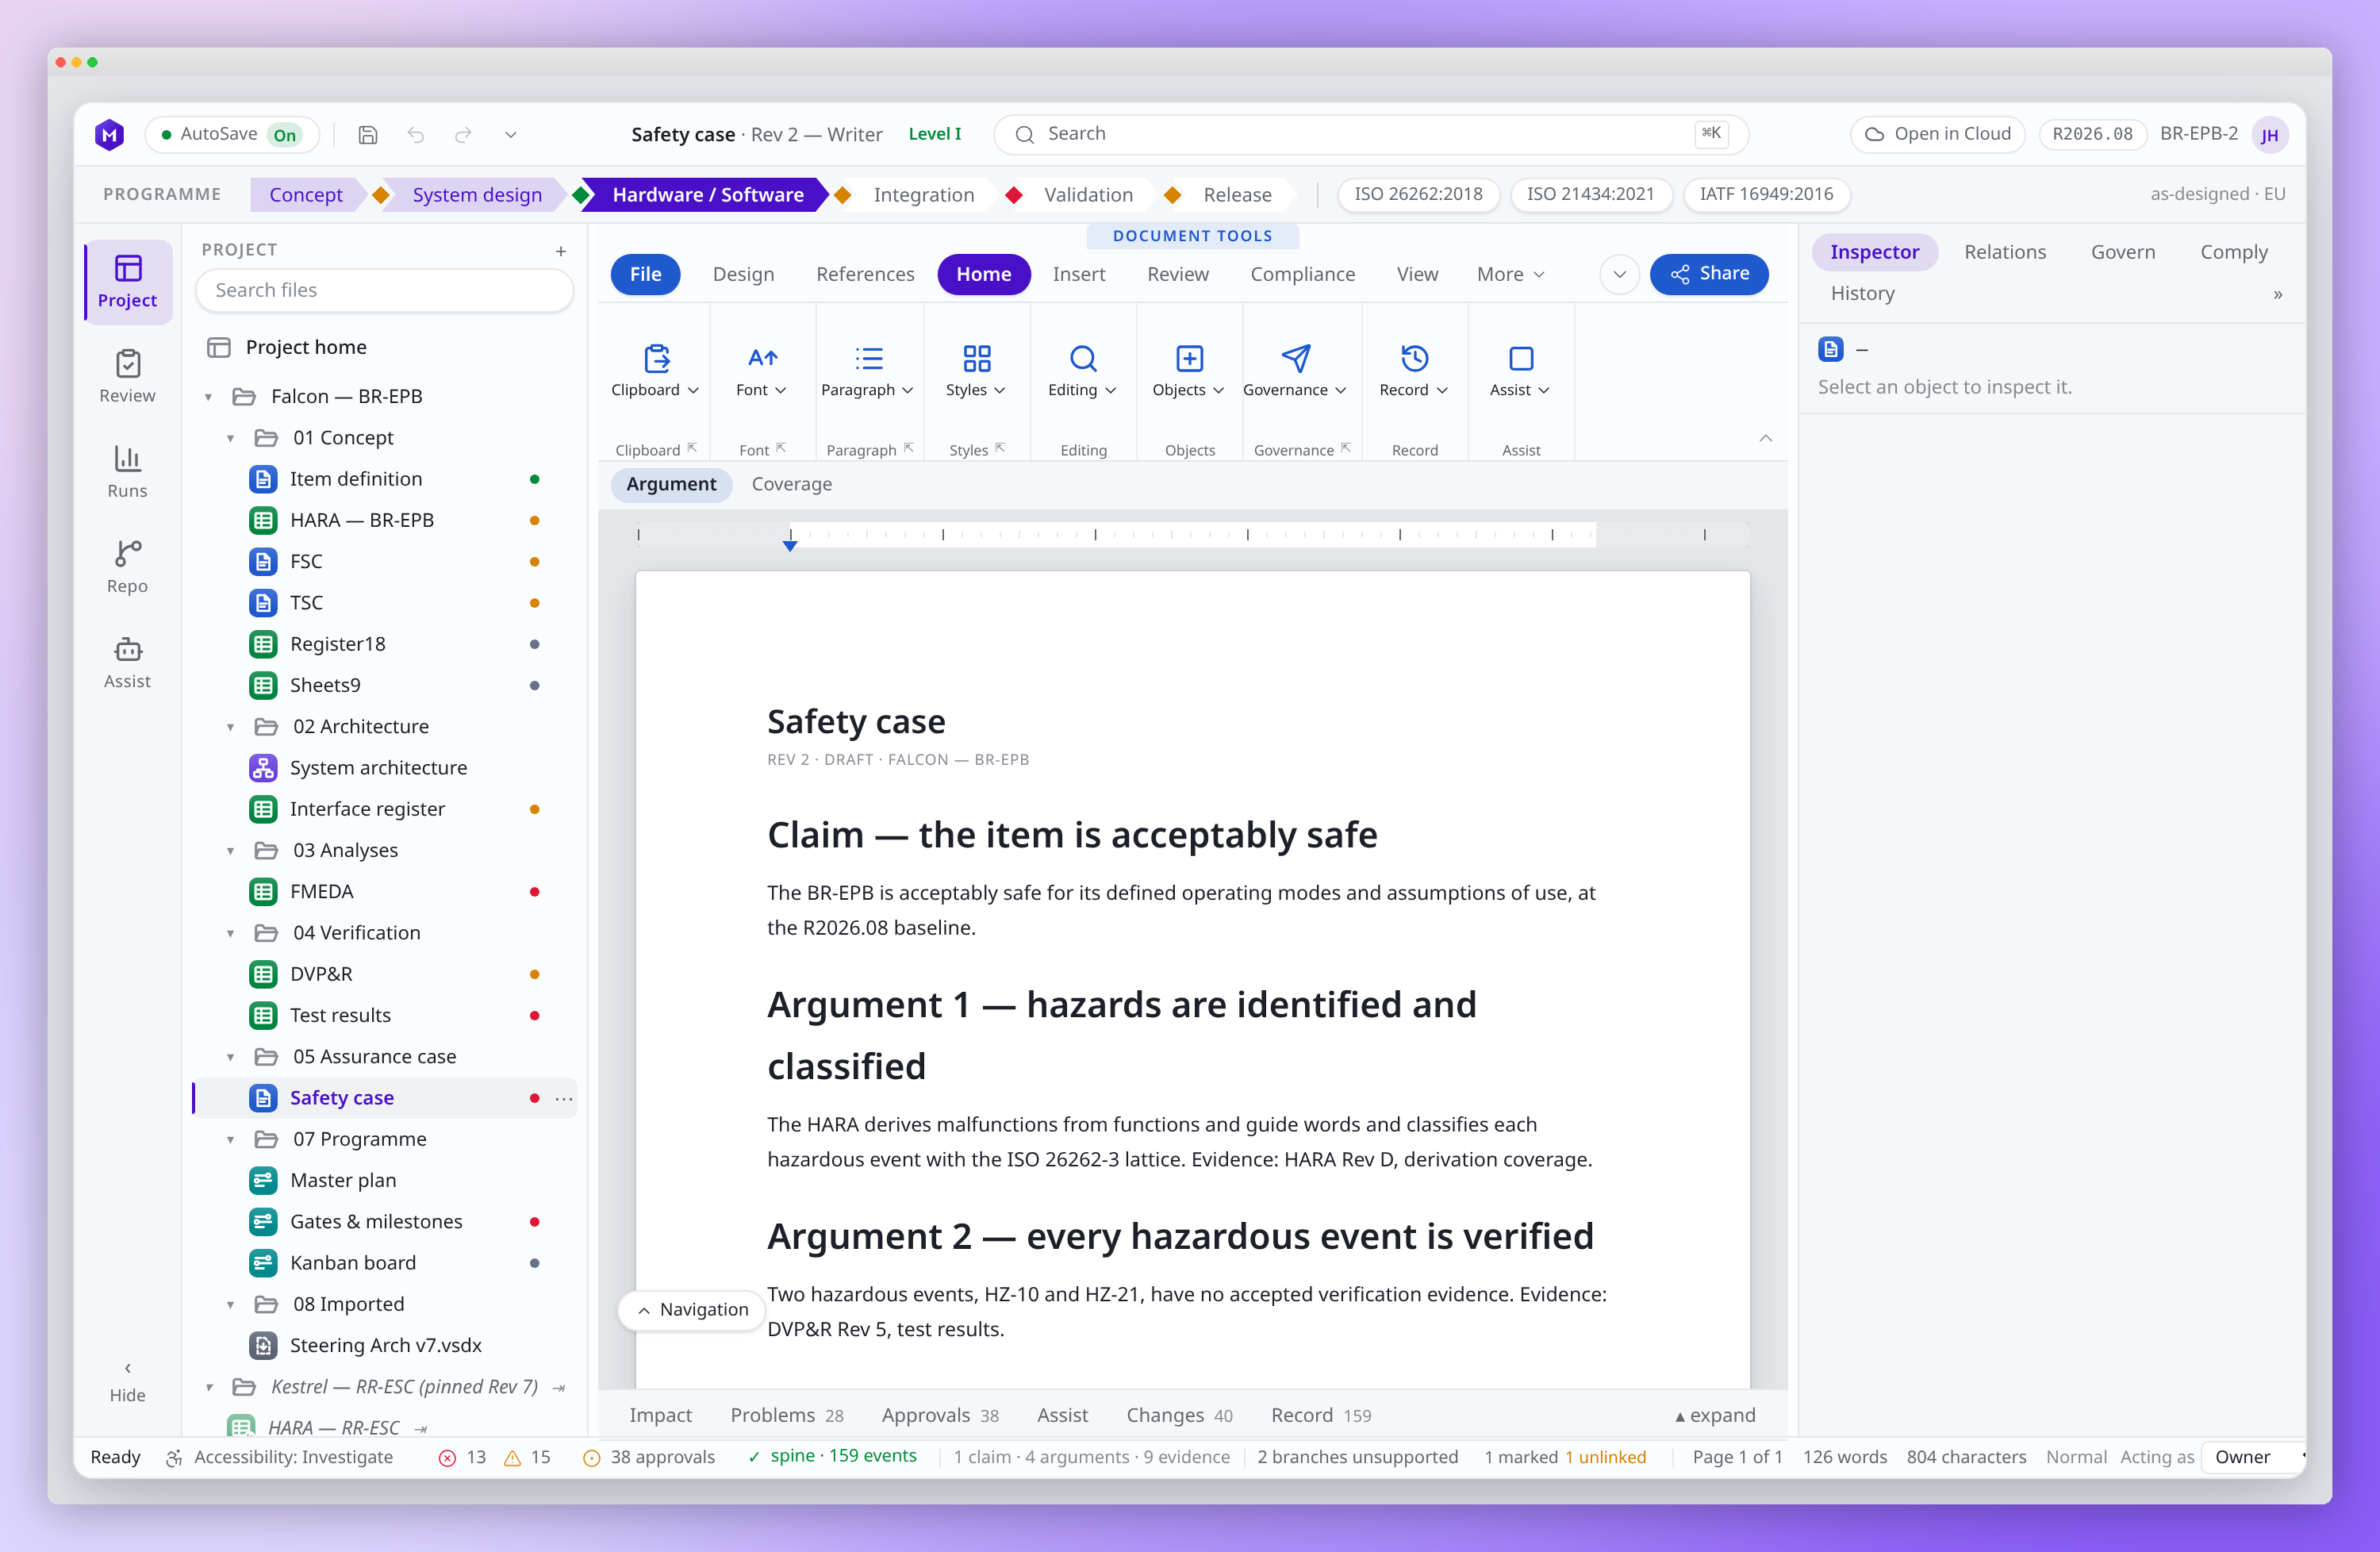
2“2 branches unsupported” is computed from the graph, not maintained by a person. - Step 3
Analysis results attach where the claim can see them
Failure modes, diagnostic coverage and metrics live as objects too, so an argument about hardware integrity is backed by the analysis itself rather than a paragraph describing it.
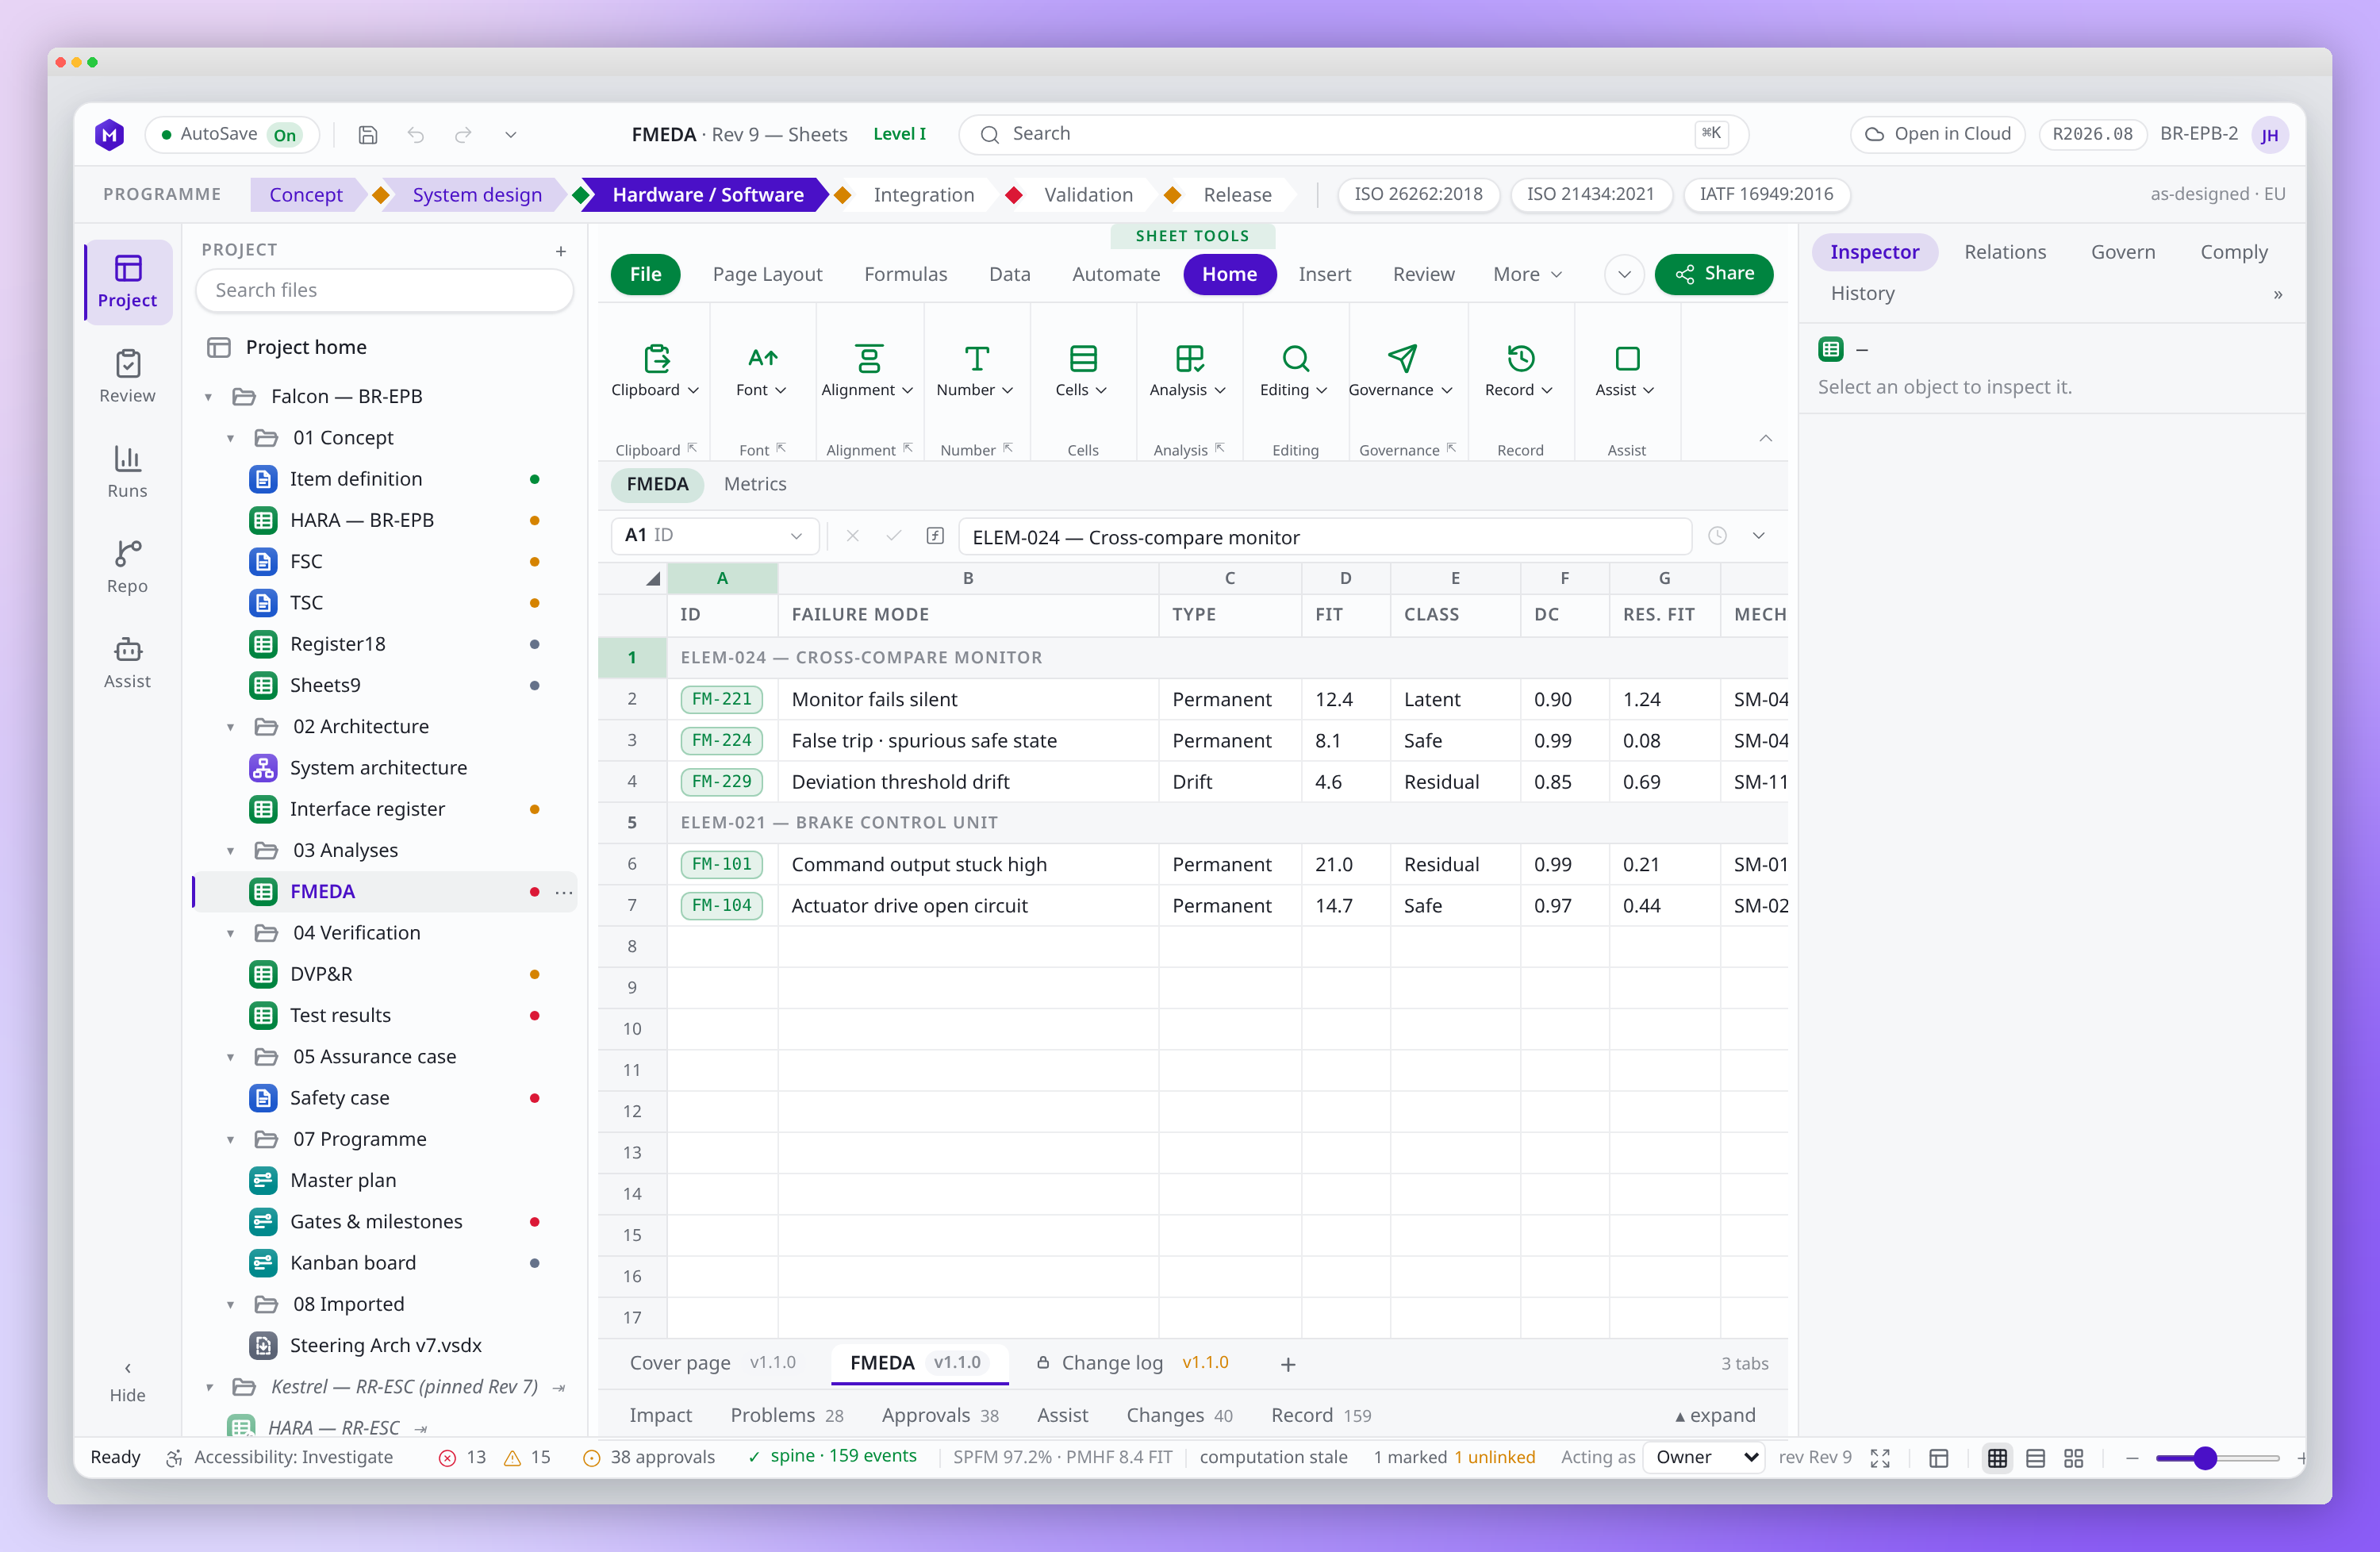
3Change a diagnostic coverage figure and every claim resting on it is flagged. - Step 4
The gate shows what is actually ready
Gate criteria are bound to the objects that satisfy them, so readiness is a query. Nothing is assembled to answer the question of whether the milestone can be passed.
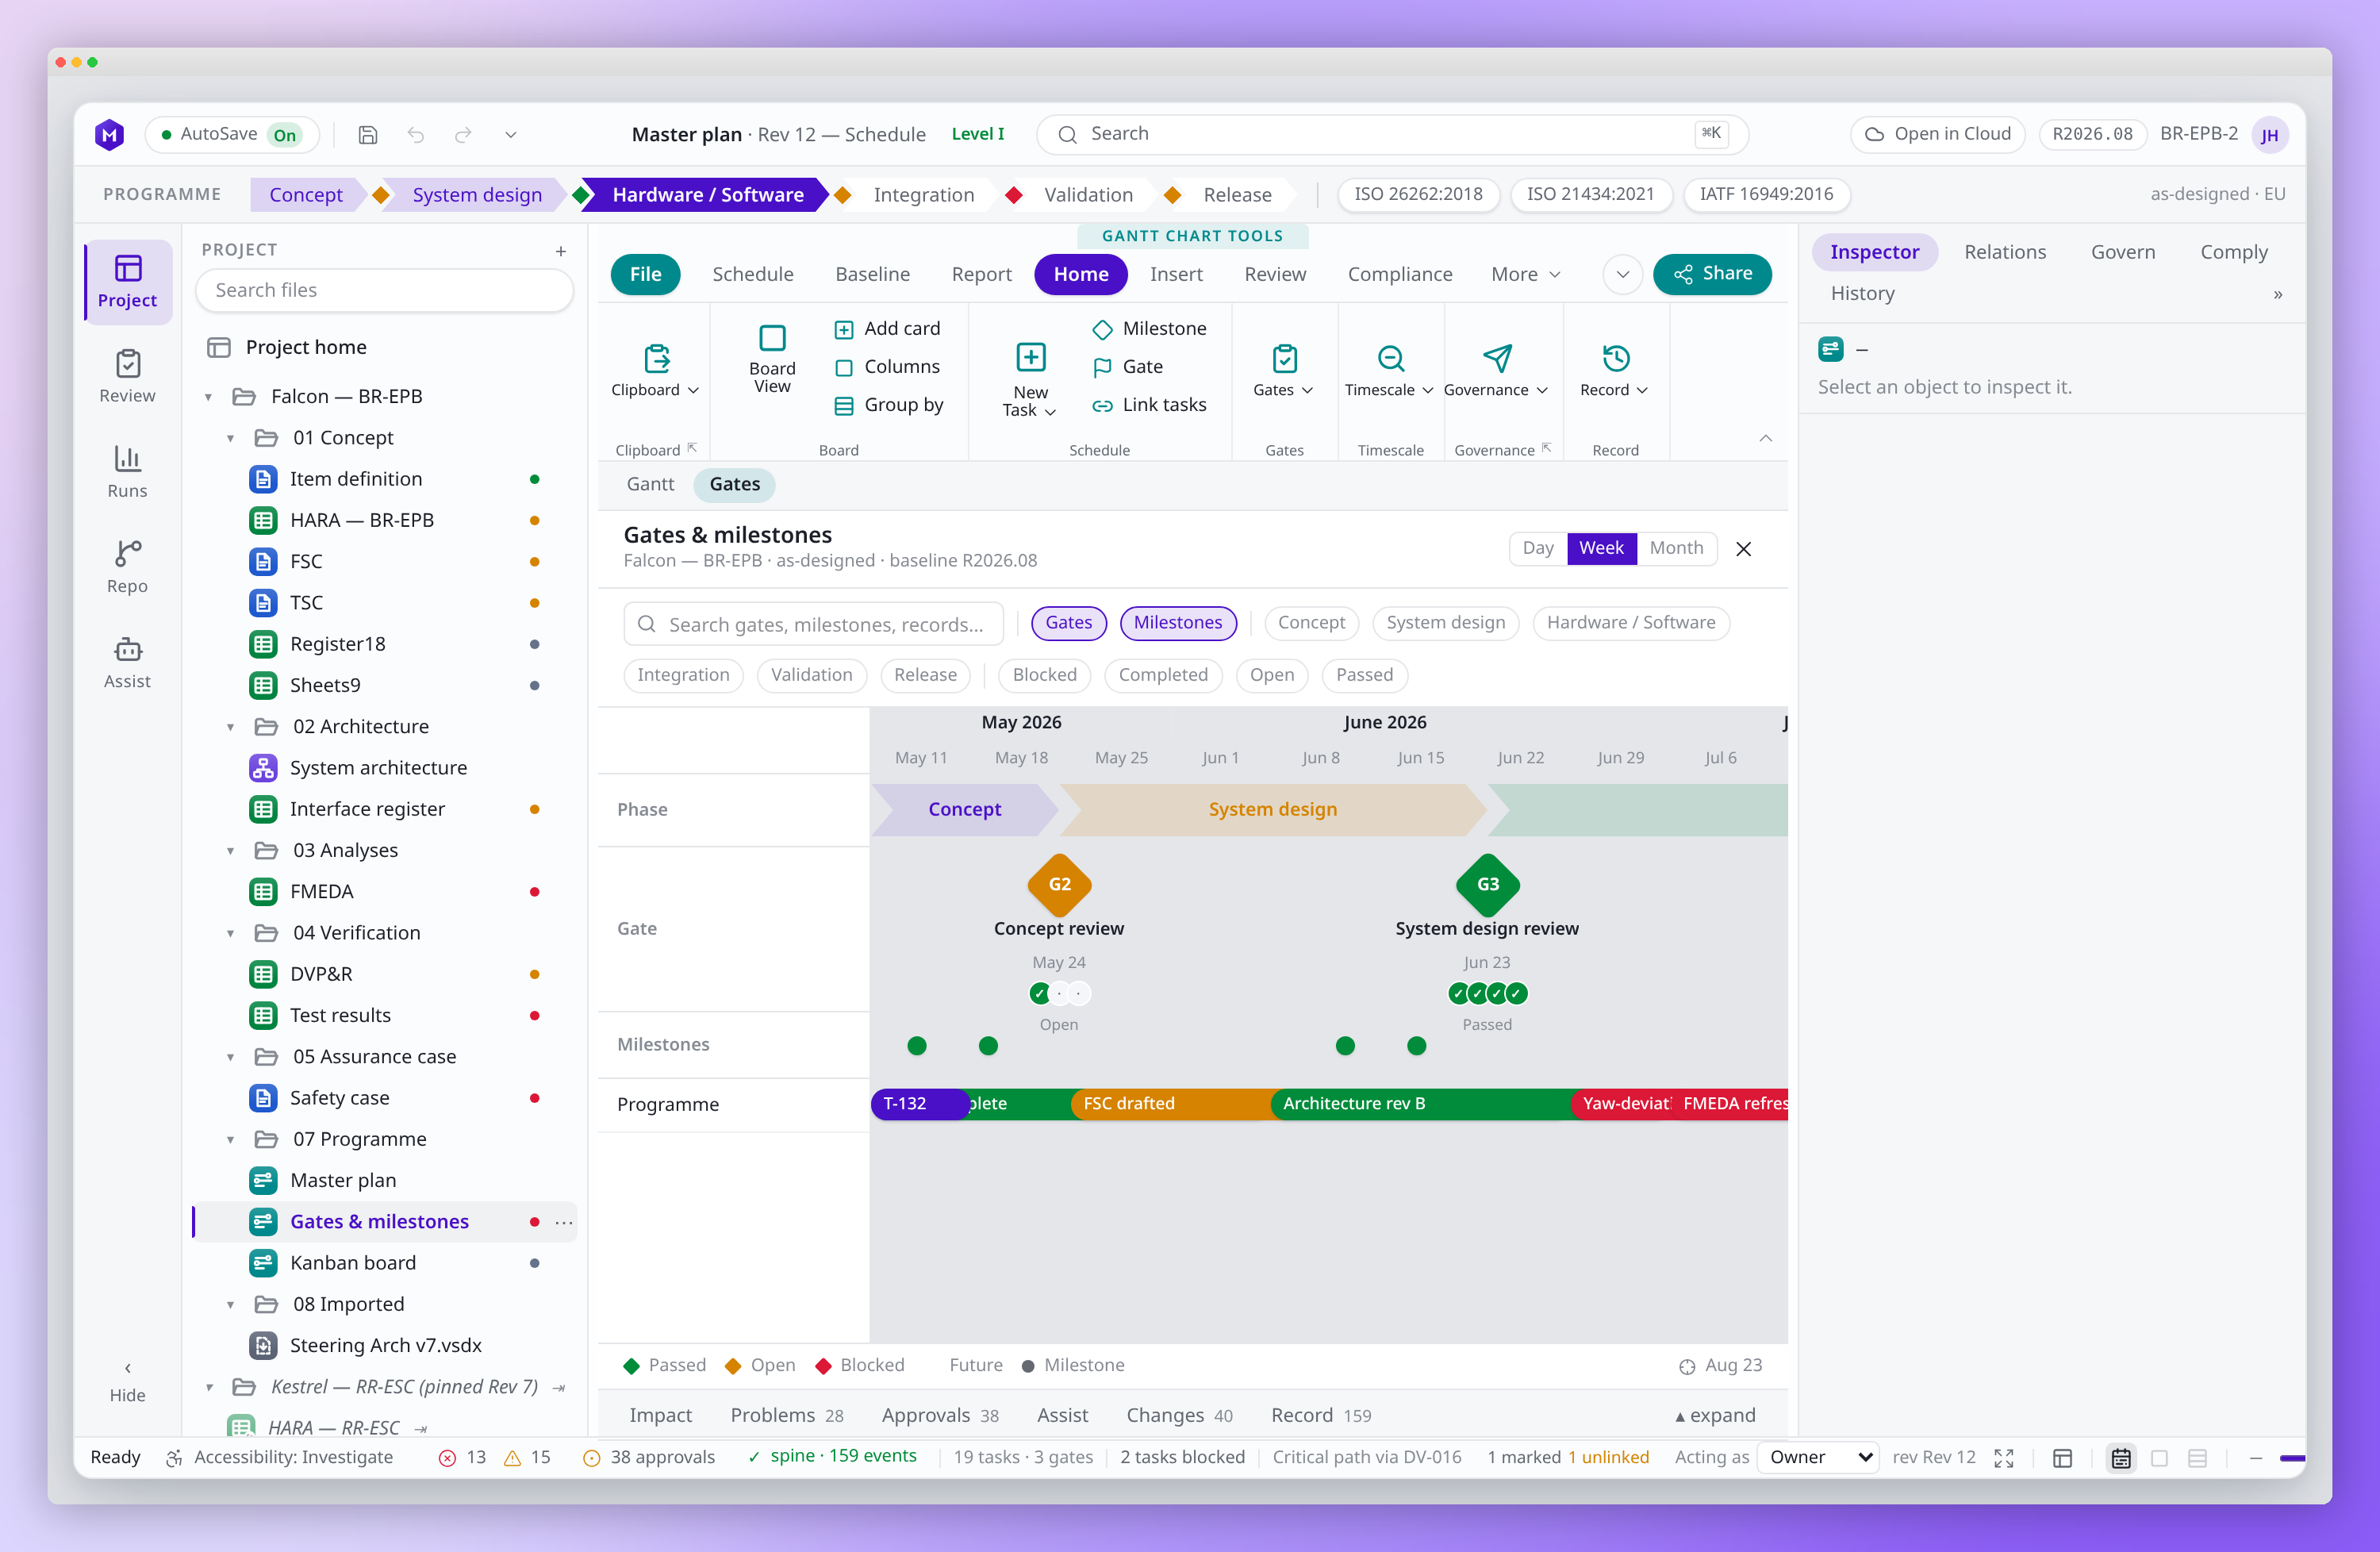
4Sign-off ticks are per criterion, and a gate stays open while a criterion is unsupported.
What changes
- The safety case is compiled ahead of each milestone
- Changed assumptions are found by re-reading
- Evidence gaps surface at review
- Assurance work spikes before every gate
- The safety case is a view that is always current
- A changed assumption flags every claim that leaned on it
- Gaps are visible the day they appear
- Milestone preparation is reading, not rebuilding
This walkthrough uses a braking-system programme because that is the worked example in the product today. The mechanism — claims holding their evidence, changes propagating to what depended on them — is domain-independent.